
.svg "Snic_solutions-COLOR (2)")
Equipment Effectiveness Challenges
Maximizing equipment effectiveness is challenging due to unplanned downtime, inconsistent maintenance, and limited visibility into performance data. Manufacturers often rely on manual tracking or siloed systems, making it difficult to identify root causes of inefficiency. Without real-time monitoring and analytics, optimizing availability, performance, and quality remains out of reach.

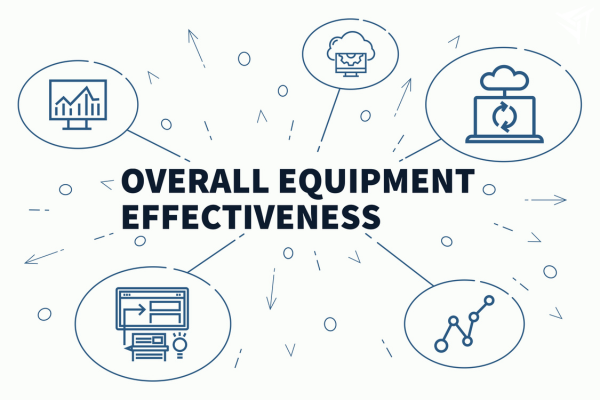
What does OEE Software Do?
OEE (Overall Equipment Effectiveness) Software tracks and analyzes equipment performance to identify productivity losses across availability, performance, and quality. It captures real-time data from machines and production lines to calculate OEE scores and highlight bottlenecks. This enables manufacturers to reduce downtime, increase throughput, and drive continuous improvement across operations.
Automated Reporting
Generates scheduled, detailed reports and dashboards that consolidate OEE metrics, trends, and performance indicators. Simplifies review and supports continuous improvement.
Real-Time Monitoring
Continuously tracks equipment performance by capturing live data on uptime, speed, and utilization. Enables proactive alerts and efficient resource management to maximize operations.
Advanced Analytics
Processes equipment data using robust algorithms to pinpoint inefficiencies, predict maintenance needs, and provide actionable insights that drive process improvements.
/About%20Page/Blake%20Digital%20Transformation%20Solutions.png?width=500&height=500&name=Blake%20Digital%20Transformation%20Solutions.png)

OEE Software Integration
OEE Software is vital in the smart manufacturing ecosystem by integrating with systems like MES, SCADA, and ERP to measure and optimize equipment performance in real time.
What happens when you integrate?
Integration enables seamless data capture from machines, delivering real-time visibility into availability, performance, and quality. This supports proactive maintenance and continuous improvement across the shop floor.


Why Manufacturers Struggle to Use Data — and How Data Integration Fixes It
Alex is an operations leader at a manufacturing plant. He’s aware that his IT team…
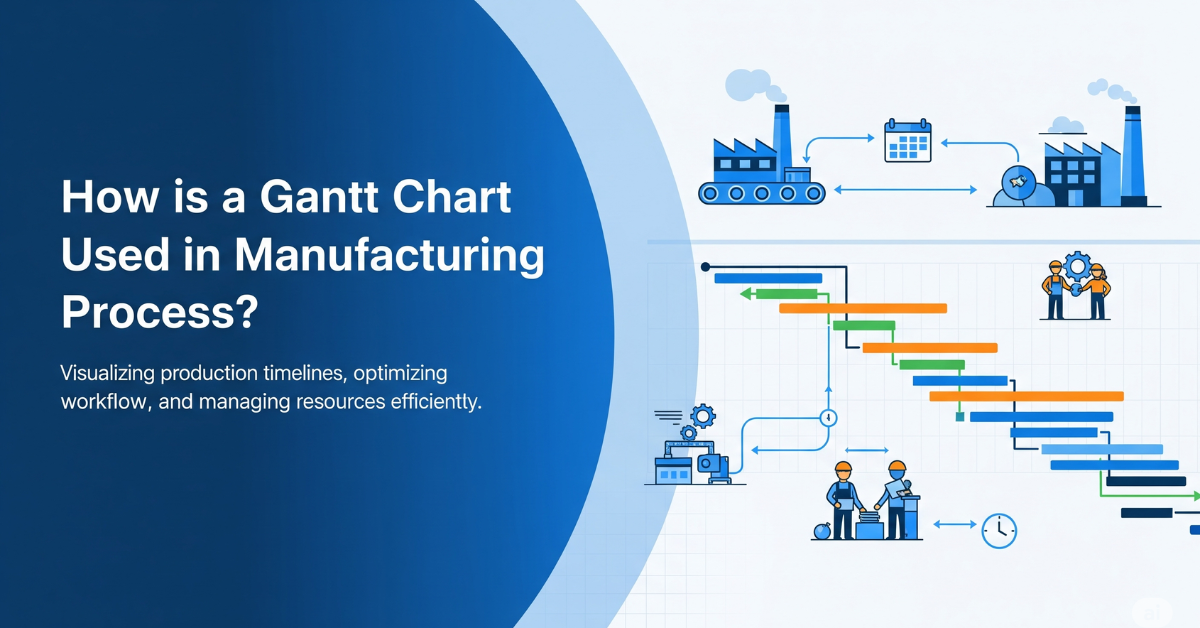
How is a Gantt Chart Used in Manufacturing Process?
In manufacturing, Gantt charts are used to simplify production by visualising task…
.png)
Top Advantages of Laboratory Automation Systems
Are you curious about how laboratory automation can benefit your lab? Laboratory a…