
.svg "Snic_solutions-COLOR (2)")
How is a Gantt Chart Used in Manufacturing Process?
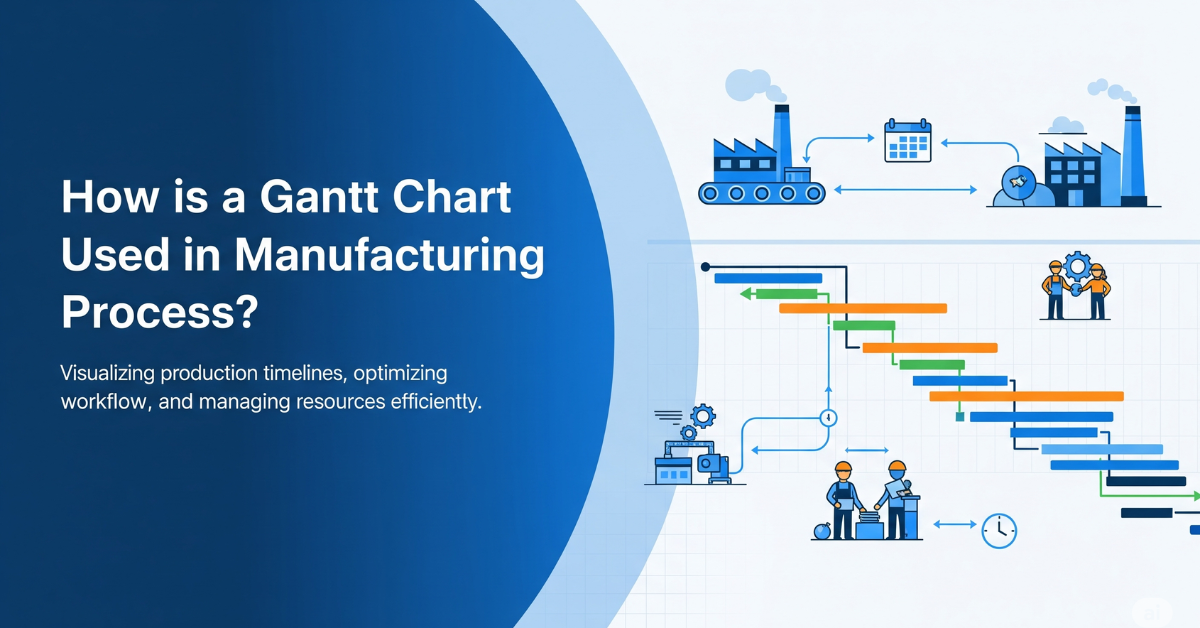
How is a Gantt Chart Used in Manufacturing Process?
Oct 20, 2025
10
min read
How to Make a Production Schedule for Manufacturing
.png)
How to Make a Production Schedule for Manufacturing
Sep 15, 2025
13
min read
How AI is Transforming Production Planning
.png)
How AI is Transforming Production Planning
Sep 8, 2025
4
min read
Top 7 Advantages of Production Planning You Can't Miss
.png)
Top 7 Advantages of Production Planning You Can't Miss
Sep 1, 2025
4
min read
Mastering Production Planning KPIs: Key Metrics for Manufacturing Efficiency
.png)
Mastering Production Planning KPIs: Key Metrics for Manufacturing Efficiency
Jul 30, 2025
15
min read
Mastering Make-To-Order (MTO): What is MTO and How It Helps
.png)
Mastering Make-To-Order (MTO): What is MTO and How It Helps
Jul 30, 2025
6
min read
Make to Order vs Make to Stock: The Ultimate Guide
.png)
Make to Order vs Make to Stock: The Ultimate Guide
Jul 25, 2025
10
min read
Manufacturing Scheduling Software for Small Business

Manufacturing Scheduling Software for Small Business
Feb 7, 2025
10
min read
Improving Supply Chain Management
Improving Supply Chain Management
Mar 26, 2024
8
min read
The Future of Sustainable Manufacturing: Best Practices and Strategies

The Future of Sustainable Manufacturing: Best Practices and Strategies
Aug 14, 2023
7
min read