
.svg "Snic_solutions-COLOR (2)")
Introduction to Procurement KPIs
Procurement Key Performance Indicators (KPIs) are measurable values that track how effectively an organization manages its purchasing activities. By monitoring procurement KPIs, businesses can evaluate cost efficiency, supplier performance, compliance, and overall procurement effectiveness. Continuous monitoring of KPIs allows businesses to adapt strategies based on performance data and market changes. In today’s competitive environment, procurement leaders need clear benchmarks that align with corporate strategy and drive long-term value.
Essential procurement KPIs are a critical set of metrics that procurement teams must monitor to gain comprehensive insights into their operations, covering costs, supplier performance, and process efficiency.

Tracking procurement KPIs not only provides valuable data but also supports effective procurement management by helping organizations optimize supplier relationships, streamline processes, and improve procurement strategies.
Many organizations confuse procurement KPIs, metrics, and OKRs, but each plays a distinct role in performance management:
-
Procurement Metrics are raw data points, such as the number of purchase orders processed or the average supplier lead time.
-
Procurement KPIs transform those metrics into performance measurements, such as reducing purchase order cycle time or achieving a higher on-time delivery rate. Procurement KPI measures, like defect rate and supplier availability, are specific indicators used to evaluate procurement performance.
-
Procurement OKRs (Objectives and Key Results) set strategic, time-bound goals that tie directly to KPIs—for example, “Reduce maverick spend to under 5% within the next fiscal year.”
Why Procurement KPIs Matter
Tracking procurement KPIs ensures that procurement is not just seen as a cost center, but as a value-driving function. Tracking these KPIs also helps evaluate the procurement team's effectiveness and overall performance.

The right KPIs help organizations:
-
Optimize Costs: Identify savings opportunities through smarter sourcing and negotiation.
-
Improve Efficiency: Reduce bottlenecks in purchase orders, approvals, and invoice processing.
-
Strengthen Supplier Relationships: Track on-time delivery, quality scores, and supplier risk ratings. Stakeholder satisfaction is a key indicator of the procurement team's performance, reflecting how well procurement meets internal needs.
-
Drive Compliance and Risk Management: Monitor spend under management, policy adherence, and contract compliance.
-
Support Sustainability Goals: Measure supplier diversity, ESG compliance, and sustainable sourcing initiatives.
Aligning KPIs With Business Strategy
Procurement KPIs are only effective when aligned with broader business objectives. For example, if a company is prioritizing sustainability, then KPIs should include supplier diversity spend or carbon footprint of procurement. If cost optimization is the primary focus, KPIs such as cost savings achieved and total cost of ownership (TCO) should take priority. Aligning KPIs with business strategy ensures the efficiency and effectiveness of the organization's procurement management by measuring and improving procurement processes in line with strategic goals.

Procurement Process Overview
The procurement process is the backbone of any organization’s ability to acquire the goods and services needed to operate efficiently and competitively. A well-structured procurement process not only delivers significant cost savings but also strengthens supplier relationships and boosts customer satisfaction. By understanding each stage of the procurement cycle and applying the right key performance indicators (KPIs), organizations can optimize procurement performance and drive continuous improvement.
Key Stages of the Procurement Cycle
The procurement cycle is made up of several essential stages, each playing a critical role in ensuring an efficient procurement process:
-
Need Identification: The process begins with recognizing and defining the requirement for a specific good or service. Clear need identification helps prevent unnecessary spending and aligns procurement activities with business objectives.
-
Supplier Selection: At this stage, procurement teams evaluate and choose suppliers based on criteria such as price, quality, reliability, and compliance. Effective supplier selection is crucial for achieving cost savings and building strong supplier relationships.
-
Purchase Order Creation: Once a supplier is chosen, a purchase order (PO) is generated to formalize the transaction. The PO outlines the terms, quantities, and delivery expectations, serving as a contractual agreement between the organization and the supplier.
-
Invoice Processing: After goods or services are delivered, the supplier submits an invoice. Efficient invoice processing ensures timely verification and approval, reducing the risk of errors and delays.
-
Payment Processing: The final stage involves processing payment to the supplier according to agreed terms. Timely payments help maintain positive supplier relationships and can lead to better negotiation outcomes in the future.
How KPIs Map to Each Stage
Applying key performance indicators at each stage of the procurement cycle enables organizations to measure procurement performance, identify bottlenecks, and uncover opportunities for cost savings:
-
Cost Savings: During supplier selection, KPIs such as cost savings achieved and price competitiveness help ensure the chosen supplier delivers the best value for money.
-
Supplier Performance: At the purchase order creation stage, KPIs like supplier on-time delivery rate and supplier defect rate monitor whether suppliers are meeting quality and delivery expectations.
-
Procurement Cycle Time: In the invoice processing stage, tracking procurement cycle time and invoice processing time highlights process efficiency and helps reduce delays.
-
Procurement ROI: At the payment processing stage, procurement ROI and cost per invoice KPIs assess whether procurement investments are generating measurable returns.
By mapping KPIs to each stage of the procurement process, organizations gain actionable insights into procurement efficiency, cost control, and supplier performance.
This approach not only supports continuous improvement but also ensures that procurement activities are aligned with broader business goals, ultimately enhancing customer satisfaction and driving long-term value.
Foundations of Procurement Measurement
Procurement success depends on more than simply tracking costs. To make meaningful improvements, organizations must understand the hierarchy of procurement metrics, KPIs, and OKRs—three layers that work together to measure performance, guide strategy, and ensure accountability.

Key procurement functions such as purchase request management and supplier management are among the areas measured and optimized through KPIs.
Procurement Metrics: The Building Blocks
Procurement metrics are the raw data points that capture transactional activity within the procurement process. These numbers provide the foundation for performance measurement but don’t tell the full story on their own.
Examples of Procurement Metrics:
-
Number of purchase orders created in a month
-
Total procurement spend
-
Average order value
-
Supplier lead times (days from PO to delivery)
-
Invoice processing time (days per invoice)
While metrics highlight what is happening, they don’t explain whether performance is meeting business objectives. That’s where KPIs come in.
Procurement KPIs: Measuring What Matters
Procurement KPIs are targeted performance indicators derived from metrics. They evaluate how well procurement processes are performing against goals such as cost savings, supplier performance, or compliance. Supplier defect rate is used to evaluate a supplier's individual quality. Tracking key procurement KPIs is essential for optimizing procurement processes, improving supplier relationships, and driving overall value.

Examples of Procurement KPIs:
-
Purchase Order (PO) Cycle Time – Average number of days from requisition approval to PO creation.
-
Supplier On-Time Delivery Rate – Percentage of orders delivered on or before the agreed date.
-
Spend Under Management (SUM) – Share of total spend managed through approved suppliers and contracts.
-
Maverick Spend – Percentage of purchases made outside established procurement processes.
Unlike raw metrics, KPIs provide actionable insights by showing whether procurement is driving efficiency, reducing risk, and supporting business priorities. KPI measures, such as ROI, cost reduction, defect rates, and project delivery, are used to assess procurement effectiveness and efficiency.
Procurement OKRs: Strategic Goal Setting
Objectives and Key Results (OKRs) take measurement one step further by linking KPIs to strategic outcomes. OKRs combine qualitative objectives with quantitative key results to set clear, time-bound targets.
Example Procurement OKR:
-
Objective: Strengthen supplier performance and resilience.
-
KR1: Achieve a 95% on-time delivery rate from top 20 suppliers.
-
KR2: Reduce supplier defect rate to below 1%.
-
KR3: Cut average supplier lead time by 20% within six months.
-
This framework ensures procurement teams are not just tracking numbers but aligning their efforts with organizational goals such as cost optimization, supply chain resilience, or sustainability.
How Metrics, KPIs, and OKRs Work Together
Think of these three layers as a pyramid:
-
Metrics = raw data (inputs).
-
KPIs = performance measures (outputs).
-
OKRs = strategic targets (outcomes).
By connecting these elements, procurement teams move beyond operational reporting and start driving strategic impact.
Core Procurement KPIs: Top 10 Essentials
While procurement teams can track dozens of performance measures, a focused set of core KPIs provides the clearest insights into efficiency, supplier performance, compliance, and cost control. These top 10 KPIs represent the essential procurement KPIs every organization should monitor. Below are the ten most critical procurement KPIs every organization should monitor.
1. Cost Savings Achieved
-
Definition: Tracks the percentage or dollar value of savings generated from sourcing initiatives, supplier negotiations, or process improvements.
-
Formula: (BaselineSpend–ActualSpend)÷BaselineSpend×100
-
Why it Matters: Demonstrates procurement’s direct impact on profitability and serves as a primary driver of procurement cost reduction.
-
Example Target: Achieve 10% cost savings across top spend categories annually.
2. Procurement ROI
-
Definition: Measures the return on investment generated by procurement compared to the cost of running the function. Procurement ROI is a key measure of procurement return on procurement investment, helping organizations evaluate the profitability and cost-effectiveness of their procurement activities.
-
Formula: (TotalValueDelivered÷ProcurementCosts)
-
Why it Matters: Positions procurement as a value-driving function, not just an operational necessity. Tracking procurement return helps organizations assess the value generated from procurement investment and supports strategic decision-making.
-
Example Target: Deliver at least 5:1 ROI.
3. Purchase Order (PO) Cycle Time
-
Definition: Average time taken from purchase requisition approval to issuing a purchase order, marking the initial step that triggers the purchase order cycle.
-
Formula: Avg.(POApprovalDate–RequisitionDate)
-
Why it Matters: Shorter cycle times from purchase requisition submission to order completion improve procurement efficiency, vendor responsiveness, and help manage organizational metrics such as cycle time and cost. Shortening purchase order cycle time can lead to faster delivery and improved cash flow.
-
Example Target: Reduce PO cycle time to under 3 business days.
4. Supplier Lead Time
-
Definition: Measures how long suppliers take to fulfill orders once a PO is placed.
-
Formula: Avg.(DeliveryDate–POIssueDate)
-
Why it Matters: Longer lead times can delay production schedules and increase inventory costs.
-
Example Target: Cut lead times by 20% year-over-year.
5. Supplier On-Time Delivery (OTD) Rate
-
Definition: Percentage of supplier orders delivered on or before the agreed delivery date.
-
Formula: (On−TimeDeliveries÷TotalDeliveries)×100
-
Why it Matters: Ensures operational continuity and customer satisfaction; meeting delivery deadlines is a key factor in supplier performance assessments.
-
Example Target: Maintain ≥95% OTD across all critical suppliers.
6. Supplier Defect Rate / Quality Score
-
Definition: Tracks the percentage of shipments or items that fail to meet quality requirements.
-
Formula: (DefectiveUnits÷TotalUnitsReceived)×100(Defective Units ÷ Total Units Received) × 100(DefectiveUnits÷TotalUnitsReceived)×100
-
Why it Matters: High defect rates increase costs, waste, and reputational risk. Monitoring supplier defect rates helps evaluate supplier quality and reliability, and informs procurement strategies.
-
Example Target: Maintain defect rate below 1%.
7. Spend Under Management (SUM)
-
Definition: The share of organizational spend managed through contracts, systems, or approved suppliers.
-
Formula: (SpendUnderManagement÷TotalSpend)×100(Spend Under Management ÷ Total Spend) × 100(SpendUnderManagement÷TotalSpend)×100
-
Why it Matters: Higher SUM = better cost control, reduced risk, and improved visibility.
-
Example Target: 85% of total spend under management.
8. Compliance Rate
-
Definition: Percentage of purchases made in alignment with approved contracts and procurement policies. The proportion of disputed invoices relative to total invoices is also an important indicator of supplier reliability and compliance.
-
Formula:(CompliantPurchases÷TotalPurchases)×100(Compliant Purchases ÷ Total Purchases) × 100(CompliantPurchases÷TotalPurchases)×100
-
Why it Matters: Protects organizations from leakage, regulatory violations, and supplier risk. Compliance rates are pivotal to ensure legal security. A high rate of disputed invoices can signal issues with supplier compliance and reliability.
-
Example Target: Achieve ≥90% compliance rate.
9. Maverick Spend
-
Definition: Spend made outside of approved procurement processes or without authorized suppliers.
-
Formula: (MaverickSpend÷TotalSpend)×100
-
Why it Matters: Highlights policy non-compliance and uncontrolled costs.
-
Example Target: Keep maverick spend below 5%.
10. Supplier Diversity & Sustainability Index
-
Definition: Measures how much spend is allocated to diverse suppliers (minority-, women-owned, etc.) and sustainable/ESG-compliant vendors.
-
Formula: (DiverseorSustainableSpend÷TotalSpend)×100
-
Why it Matters: Aligns procurement with corporate social responsibility and ESG targets.
-
Example Target: At least 20% of supplier spend allocated to diverse or sustainable vendors.
Expanded Procurement KPI Framework: 30+ Advanced KPIs
Beyond the core set of procurement KPIs, leading organizations track a wider set of performance indicators that provide deeper insights into costs, process efficiency, supplier reliability, and sustainability. Tracking the number of suppliers is essential, as it helps assess supply chain complexity and risk by revealing both dependency on too few vendors and the challenges of managing too many suppliers.

Having too many suppliers can increase complexity and reduce procurement efficiency, making it important to find an optimal balance. This expanded framework ensures procurement teams measure not only financial performance, but also risk, innovation, and long-term value creation.
A. Cost & Financial Performance KPIs
These KPIs focus on cost savings, spend optimization, and procurement’s financial contribution.
-
Cost Savings Achieved – % or $ reduction vs. baseline.
-
Cost Avoidance – Value gained by preventing price increases or unnecessary purchases.
Procurement ROI – Value delivered ÷ cost of procurement function.
-
Total Cost of Ownership (TCO) – Lifecycle cost of products/services beyond purchase price, including all associated costs such as maintenance, support, and disposal over the product or service's lifecycle.
Spend Under Management (SUM) – % of spend managed via contracts and approved suppliers.
-
Maverick Spend – % of uncontrolled spend outside procurement processes.
-
Savings from e-Procurement / Automation – Cost reduction through digital procurement tools.
-
Annual Procurement Costs – Total cost of procurement operations, including technology and headcount.
-
Price Competitiveness – Benchmarking prices paid vs. industry averages, analyzing the price paid compared to market or standard prices to assess procurement efficiency.
B. Process Efficiency & Operations KPIs
These KPIs evaluate speed, automation, and efficiency of procurement workflows. Analyzing the purchasing process can reveal inefficiencies and opportunities for cost savings.
-
Purchase Order (PO) Cycle Time – Avg. time requisition → PO approval.
-
Procurement Cycle Time – Total time from requisition to goods receipt/payment.
-
Invoice Processing Time – Avg. days per invoice from receipt to payment.
-
Invoice Processing Cost – $ cost to process a single invoice.
-
e-Procurement Adoption Rate – % of transactions completed electronically.
-
Requisition-to-Order Accuracy – % of POs issued without errors.
-
Contract Compliance Rate – % of spend aligned with agreed contract terms.
-
Emergency Purchase Ratio – % of total purchases made under emergency conditions; this rate of emergency purchases is a key KPI for identifying how often unplanned or urgent procurement orders occur, helping to pinpoint inefficiencies in inventory management and the purchasing process.
-
Automation Rate – % of procurement processes handled through automation.
C. Supplier Performance & Risk KPIs
These KPIs measure supplier reliability, responsiveness, and contribution to innovation while monitoring risk exposure. Effective supplier evaluation also requires managing vendor performance and implementing robust vendor risk management practices to ensure supply chain stability and minimize disruptions.
-
Supplier On-Time Delivery (OTD) Rate – % delivered on or before the agreed date.
-
Supplier Lead Time – Avg. days from PO to delivery.
-
Supplier Defect Rate / Quality Score – % of shipments failing quality checks.
-
Supplier Availability Rate – % of orders fulfilled without stockouts. This KPI, also referred to as vendor availability, measures a supplier’s capacity to fulfill orders reliably and respond to demand or emergencies.
-
Supplier Responsiveness – Avg. response time to RFQs, issues, or escalations.
-
Supplier Risk Rating – Composite score of supplier’s financial, compliance, and geopolitical risk, supporting ongoing vendor risk management.
-
Supplier Innovation Contribution – % of suppliers contributing to new product or process improvements.
-
Supplier Collaboration Index – Frequency and outcomes of joint initiatives with key suppliers.
-
Supplier Relationship Strength – Internal scoring of collaboration and trust with strategic suppliers. Managed vendor performance is assessed through these KPIs, including vendor rejection rate and supplier defect rate, to ensure suppliers meet quality, delivery, cost, and responsiveness criteria.
D. Strategic Value & ESG (Sustainability) KPIs
These KPIs focus on long-term value creation, social responsibility, and alignment with corporate sustainability initiatives.
-
Supplier Diversity Spend – % of spend with minority-, women-, or veteran-owned suppliers.
-
Sustainable Procurement Spend – % of spend with ESG-compliant or green-certified suppliers.
-
Carbon Footprint of Procurement – Emissions linked to procurement and supplier network.
-
Local vs. Global Spend Ratio – % of spend sourced locally vs. internationally.
-
Ethical Sourcing Compliance – % of suppliers passing audits on labor/human rights.
-
Stakeholder Satisfaction Score – Internal stakeholder feedback on procurement’s effectiveness.
-
Risk Mitigation Coverage – % of suppliers with active risk management plans in place.
-
Innovation Sourcing – % of procurement contracts that include innovation clauses.
Procurement KPI → Metric Reference Sheet
This reference sheet provides a structured view of procurement KPIs, their definitions, underlying metrics, and formulas. The procurement department plays a crucial role in collecting data and measuring performance across these KPIs, ensuring effective cost management and supplier quality assessment. Tracking internal cost, such as expenses incurred within the organization for processes like invoice processing and purchase order creation, is essential for improving operational efficiency. This sheet serves as a calculation guide for procurement analysts and a benchmarking tool for procurement leaders.
Cost & Financial KPIs
|
KPI |
Definition |
Metrics Required |
Formula |
Example Target |
|---|---|---|---|---|
|
Cost Savings Achieved |
% of savings vs. baseline spend |
Baseline spend, Actual spend |
(Baseline Spend – Actual Spend) ÷ Baseline Spend × 100 |
10% annual savings |
|
Cost Avoidance |
Savings by preventing unnecessary cost increases, including procurement cost avoidance as a proactive strategy to prevent unnecessary or overpriced purchases and avoid future costs |
Baseline price, Negotiated price |
(Avoided Cost ÷ Baseline Cost) × 100 |
5% avoided costs |
|
Procurement Cost |
Total expenses associated with procurement activities, used to measure procurement efficiency and identify opportunities for procurement cost reduction and procurement cost avoidance |
Procurement expenses, Number of transactions |
Total Procurement Expenses ÷ Number of Transactions |
Track year-over-year reduction |
|
Procurement ROI |
Value delivered relative to cost of procurement |
Value delivered, Procurement costs |
Value Delivered ÷ Procurement Costs |
≥5:1 ROI |
|
Total Cost of Ownership (TCO) |
Lifecycle cost beyond purchase price, emphasizing the importance of considering future costs in procurement strategies |
Purchase cost, Operating costs, Maintenance costs |
Purchase + Operating + Maintenance |
Track trend reduction |
|
Spend Under Management (SUM) |
% of spend managed under contracts |
Managed spend, Total spend |
Managed Spend ÷ Total Spend × 100 |
≥85% |
|
Maverick Spend |
% of spend outside procurement processes |
Unapproved spend, Total spend |
Maverick Spend ÷ Total Spend × 100 |
< 5% |
Process Efficiency KPIs
|
KPI |
Definition |
Metrics Required |
Formula |
Example Target |
|
PO Cycle Time |
Avg. time requisition → PO approval |
Requisition date, Approval date |
Avg. (Approval Date – Requisition Date) |
<3 days |
|
Procurement Cycle Time |
Full cycle from requisition to goods receipt |
Requisition date, Delivery date |
Avg. (Delivery Date – Requisition Date) |
Reduce by 20% |
|
Invoice Processing Time |
Avg. days to process an invoice |
Invoice receipt date, Payment date |
Avg. (Payment Date – Receipt Date) |
<5 days |
|
Invoice Processing Cost |
$ cost per invoice |
Total processing cost, # invoices |
Total Cost ÷ # Invoices |
<$6 per invoice |
|
e-Procurement Adoption Rate |
% of POs issued electronically |
# of electronic POs, Total POs |
e-POs ÷ Total POs × 100 |
≥90% |
|
Requisition-to-Order Accuracy |
% of POs without errors |
# of error-free POs, Total POs |
Error-Free POs ÷ Total POs × 100 |
≥99% |
|
Contract Compliance Rate |
% of spend aligned with contracts |
Contract spend, Total spend |
Contract Spend ÷ Total Spend × 100 |
≥90% |
|
Emergency Purchase Ratio |
% of purchases made as emergencies |
Emergency POs, Total POs |
Emergency ÷ Total × 100 |
<2% |
Supplier Performance & Risk KPIs
|
KPI |
Definition |
Metrics Required |
Formula |
Example Target |
|
On-Time Delivery (OTD) Rate |
% delivered on time |
On-time deliveries, Total deliveries |
On-Time ÷ Total × 100 |
≥95% |
|
Supplier Lead Time |
Avg. time from PO to delivery |
PO issue date, Delivery date |
Avg. (Delivery – PO Date) |
Reduce by 20% |
|
Supplier Defect Rate |
% of defective shipments |
Defective units, Total units |
Defective ÷ Total × 100 |
<1% |
|
Supplier Availability Rate |
% of orders fulfilled |
Orders fulfilled, Orders placed |
Fulfilled ÷ Placed × 100 |
≥98% |
|
Supplier Responsiveness |
Avg. response time to RFQs/issues |
Response timestamps |
Avg. (Response – Request Date) |
<48 hours |
|
Supplier Risk Rating |
Composite risk score |
Financial, Compliance, Geographic risk data |
Weighted risk scoring model |
Benchmark by category |
|
Supplier Innovation Contribution |
% of suppliers involved in innovation |
Innovation projects, Total suppliers |
Innovation Suppliers ÷ Total Suppliers × 100 |
≥25% |
|
Supplier Collaboration Index |
Measures joint development success |
# of collaboration projects, Outcomes |
Qualitative/quantitative scoring |
Annual increase |
Strategic & ESG KPIs
|
KPI |
Definition |
Metrics Required |
Formula |
Example Target |
|
Supplier Diversity Spend |
% of spend with diverse suppliers |
Diverse spend, Total spend |
Diverse ÷ Total × 100 |
≥20% |
|
Sustainable Procurement Spend |
% of spend with ESG-compliant suppliers |
ESG spend, Total spend |
ESG ÷ Total × 100 |
≥30% |
|
Carbon Footprint of Procurement |
Emissions linked to procurement |
Supplier emissions data, Spend |
Scope 3 tracking |
Annual reduction |
|
Local vs. Global Spend Ratio |
% sourced locally vs. globally |
Local spend, Global spend |
Local ÷ Global × 100 |
≥40% local |
|
Ethical Sourcing Compliance |
% of suppliers passing audits |
Compliant suppliers, Total suppliers |
Compliant ÷ Total × 100 |
≥90% |
|
Stakeholder Satisfaction Score |
Internal satisfaction with procurement |
Survey results |
Avg. satisfaction rating |
≥90% |
|
Risk Mitigation Coverage |
% of suppliers with mitigation plans |
# suppliers w/ plans, Total suppliers |
Covered ÷ Total × 100 |
≥80% |
|
Innovation Sourcing |
% of contracts with innovation clauses |
Innovation contracts, Total contracts |
Innovation ÷ Total × 100 |
≥15% |
Key Takeaway
This reference sheet ensures procurement teams can measure, calculate, and benchmark every critical KPI. By connecting definitions, metrics, and formulas, organizations can move from raw data to actionable insights, and ultimately to strategic outcomes.
Emergency Purchases: Managing the Unexpected
Emergency purchases are a reality for every procurement team, arising when unforeseen events demand immediate action. Whether triggered by equipment failure, natural disasters, or sudden spikes in demand, emergency purchases can disrupt procurement processes and lead to unplanned costs. Emergency purchases are those unplanned orders which are acquired to prevent the shortage of products/services. Effectively managing emergency purchases is essential for maintaining procurement performance, controlling costs, and safeguarding customer satisfaction.
Defining Emergency Purchases
Emergency purchases refer to unplanned acquisitions made in response to urgent, unexpected situations. These purchases often require expedited shipping, special handling, and rapid decision-making, which can bypass standard procurement controls. While necessary in critical moments, emergency purchases can increase procurement costs, strain supplier relationships, and impact overall procurement efficiency.

To minimize the negative impact of emergency purchases, organizations should implement a proactive strategy that includes:
-
Identifying Potential Emergency Purchase Scenarios: Anticipate situations that could trigger emergency purchases, such as supply chain disruptions, equipment breakdowns, or sudden regulatory changes.
-
Developing an Emergency Purchase Protocol: Establish clear procedures for handling emergency purchases, including approval workflows, preferred supplier lists, and guidelines for expedited procurement.
-
Monitoring Emergency Purchase Activity: Track the frequency and value of emergency purchases using procurement metrics and key performance indicators KPIs, such as the emergency purchase ratio and spend under management. Low rates of emergency purchases indicate a more efficient procurement strategy.
-
Analyzing Emergency Purchase Data: Regularly review data on emergency purchases to identify trends, root causes, and areas for process improvement.
-
Implementing Cost Saving KPIs: Use cost saving KPIs like cost avoidance and cost reduction to ensure emergency purchases are made as cost-effectively as possible, even under pressure.
-
Tracking Supplier Performance: Evaluate supplier responsiveness and reliability during emergencies to ensure they can meet urgent requirements without compromising quality.
-
Measuring Procurement ROI: Assess the return on investment for emergency purchases to ensure that procurement spending delivers value, even in high-pressure situations.
By integrating these strategies and leveraging procurement metrics, organizations can keep emergency purchases under control, reduce unnecessary costs, and maintain high standards of supplier performance and customer satisfaction. Utilizing eProcurement tools and robust data analysis further streamlines emergency procurement processes, enabling procurement teams to make informed, data-driven decisions—even when the unexpected strikes.
Procurement OKRs: Turning KPIs into Strategic Goals
Procurement KPIs provide visibility into performance, but KPIs alone do not define success. To create business impact, procurement leaders need OKRs (Objectives and Key Results). OKRs translate performance measures into strategic, time-bound goals that align procurement with organizational priorities.
What Are Procurement OKRs?
-
Objectives are qualitative goals that describe what procurement wants to achieve (e.g., “Improve supplier reliability”).
-
Key Results (KRs) are quantifiable targets that measure progress toward that objective (e.g., “Achieve 95% supplier on-time delivery within 6 months”).
Together, they ensure procurement teams not only track performance but also deliver tangible outcomes.
Procurement OKR Examples
Objective 1: Reduce Procurement Costs While Driving Value
-
KR1: Achieve 10% cost savings across top five spend categories by year-end.
-
KR2: Increase spend under management from 65% to 85%.
-
KR3: Reduce maverick spend from 12% to <5%.
-
KR4: Improve procurement ROI to at least 5:1.
Objective 2: Improve Procurement Process Efficiency
-
KR1: Reduce purchase order cycle time from 6 days to 3 days.
-
KR2: Cut invoice processing cost from $12 to <$6 per invoice.
-
KR3: Increase e-procurement adoption rate to 90% of transactions.
-
KR4: Maintain 99% requisition-to-order accuracy.
Objective 3: Strengthen Supplier Performance & Reliability
-
KR1: Achieve 95% supplier on-time delivery rate across top 20 suppliers.
-
KR2: Reduce supplier defect rate from 3% to below 1%.
-
KR3: Shorten average supplier lead time by 20%.
-
KR4: Ensure 100% of strategic suppliers undergo quarterly performance reviews.
Objective 4: Build a Sustainable & Risk-Resilient Supply Base
-
KR1: Increase sustainable procurement spend from 15% to 30%.
-
KR2: Ensure 80% of tier-1 suppliers pass ESG compliance audits.
-
KR3: Expand supplier diversity spend to at least 20% of total procurement.
-
KR4: Reduce supply chain carbon footprint by 15% over two years.
Objective 5: Elevate Procurement’s Strategic Contribution
-
KR1: Achieve a 90% stakeholder satisfaction score across business units.
-
KR2: Increase supplier innovation contribution to 25% of new projects.
-
KR3: Conduct bi-annual supplier collaboration workshops with top 10 suppliers.
-
KR4: Align 100% of procurement initiatives with corporate strategy objectives.
How to Implement Procurement OKRs
-
Align with Business Goals: Ensure objectives connect to corporate priorities like cost optimization, resilience, or ESG.
-
Set Realistic Yet Ambitious Targets: Key results should stretch performance without being unattainable.
-
Review Regularly: Track progress quarterly to adjust initiatives and keep stakeholders engaged.
-
Cascade Across Teams: Translate organizational OKRs into departmental and individual goals for full accountability.
Practical Applications of Procurement KPIs
Tracking procurement KPIs is only valuable if the data is applied to decision-making. The real power of procurement KPIs comes from dashboards, reporting, and performance reviews that turn insights into action. Continuous monitoring of procurement KPIs helps businesses adapt to changing market conditions and set realistic targets. Many organizations use enterprise resource planning (ERP) systems to collect, store, and manage procurement data, integrating various operational systems to ensure comprehensive data analysis and business efficiency.
Procurement KPI Dashboards
A well-designed procurement dashboard consolidates key data into one view, helping procurement leaders monitor trends, identify risks, and track progress toward goals.
Essential Features of a Procurement KPI Dashboard:
-
Real-time Data Integration: Automated feeds from ERP, e-procurement, and supplier management systems.
-
Category Spend Tracking: Visualizations of spend by category, supplier, or region.
-
Performance Metrics: On-time delivery, defect rates, PO cycle time, and compliance rates.
-
Savings & ROI Analytics: Cost savings, cost avoidance, and procurement ROI trends.
-
Sustainability Metrics: Supplier diversity, ESG compliance, and carbon footprint.
Tools Commonly Used for Procurement Dashboards:
-
Power BI
-
SAP Ariba
-
Coupa
-
Oracle Procurement Cloud
Procurement Reporting Best Practices
Regular reporting ensures KPIs are not just monitored, but also used to guide business decisions.
Best Practices for Procurement Reporting:
-
Tailor to Audience: Executives care about ROI, cost savings, and risk exposure, while operational teams need detail on PO cycle times and supplier lead times.
-
Use Clear Visuals: Graphs, heatmaps, and trend lines make procurement performance data easier to interpret.
-
Set a Cadence:
-
Weekly: Tactical KPIs (orders processed, urgent purchases).
-
Monthly: Supplier performance reviews and category spend analysis.
-
Quarterly: Strategic KPIs (ROI, supplier innovation, ESG progress).
-
-
Highlight Exceptions: Focus attention on underperforming suppliers, late deliveries, or budget overruns.
Supplier Performance Tracking
Suppliers are critical to procurement success, and KPIs provide the basis for structured supplier management. Procurement managers play a key role in setting, tracking, and adjusting procurement KPIs to ensure supplier performance aligns with organizational goals.
Key Supplier Performance KPIs to Report:
-
On-time delivery rate
-
Defect/quality rate
-
Responsiveness to RFQs/issues
-
Compliance with contract terms
-
Innovation contribution
How to Use KPI Data in Supplier Reviews:
-
Conduct quarterly business reviews (QBRs) with strategic suppliers.
-
Benchmark supplier performance against industry peers.
-
Tie supplier scorecards to performance incentives or penalties.
-
Collaborate on improvement plans where KPIs fall below targets.
Common Pitfalls to Avoid
Many organizations fail to extract value from procurement KPIs due to poor execution.
Top Mistakes in KPI Application:
-
Tracking too many KPIs: Creates noise and confusion. Focus on 10–20 high-value indicators.
-
Lack of alignment: Measuring cost savings while the business is focused on ESG sends mixed signals.
-
Static measurement: Failing to update KPI targets as business priorities shift.
-
Siloed data: Using disconnected systems that prevent accurate, real-time tracking.
Best Practices in Procurement KPI Management
Implementing procurement KPIs effectively requires more than just choosing the right indicators. To ensure KPIs drive measurable business outcomes, procurement leaders must adopt a set of best practices that balance strategy, technology, and continuous improvement.
1. Align KPIs with Business Objectives
Procurement KPIs should directly support broader organizational goals. For example:
-
If the company prioritizes cost optimization, focus on KPIs like cost savings, procurement ROI, and total cost of ownership (TCO).
-
If sustainability is a corporate priority, emphasize supplier diversity spend, ESG compliance, and carbon footprint reduction.
-
If the strategy is resilience, track supplier lead times, risk ratings, and mitigation coverage.
Best Practice: Review corporate strategy annually and update procurement KPIs to remain relevant.
2. Focus on a Balanced KPI Portfolio
Avoid overemphasizing cost savings at the expense of supplier quality or compliance. A well-rounded procurement dashboard includes KPIs across four categories:
-
Financial: cost savings, ROI, spend under management.
-
Process Efficiency: PO cycle time, invoice processing time.
-
Supplier Performance: on-time delivery, defect rate, responsiveness.
-
Strategic Value & ESG: diversity spend, innovation contribution, carbon footprint.
Best Practice: Limit the dashboard to 15–20 high-impact KPIs that cover all dimensions.
3. Leverage Digital Procurement Tools
Modern procurement requires digital platforms that automate data collection and enable real-time KPI tracking. Tools like SAP Ariba, Coupa, Oracle Procurement Cloud, and Jaggaer provide:
-
Supplier performance scorecards.
-
Risk and compliance monitoring.
-
Advanced analytics dashboards.
Best Practice: Integrate procurement KPIs into BI tools like Power BI or Tableau for interactive, visual insights.
4. Engage Suppliers in KPI Tracking
Supplier performance is at the heart of procurement success. The most effective organizations share KPI scorecards with suppliers and build accountability into contracts.
Best Practice:
-
Include KPIs like on-time delivery, defect rate, and ESG compliance in supplier agreements.
-
Conduct quarterly business reviews (QBRs) where suppliers see their own KPI performance.
-
Reward top-performing suppliers and develop improvement plans for underperformers.
5. Continuously Review and Improve KPIs
Business conditions and supply chain risks are always evolving. Static KPIs quickly lose relevance.
Best Practice:
-
Conduct quarterly reviews of procurement KPIs to assess alignment with strategy.
-
Retire KPIs that no longer add value and introduce new ones as priorities shift.
-
Benchmark KPI performance against industry standards to maintain competitiveness.
6. Foster a Data-Driven Culture
Procurement KPIs should empower teams, not just generate reports. Procurement professionals must understand how their daily activities impact the KPIs being tracked.
Best Practices
-
Train procurement staff on KPI definitions, metrics, and calculation methods.
-
Create transparency by sharing dashboard results across the team.
-
Use KPIs to motivate performance, not just monitor compliance.
Key Takeaway
The organizations that gain the most from procurement KPIs are those that:
-
Align KPIs with business goals,
-
Balance financial, process, supplier, and ESG metrics,
-
Use digital tools for automation,
-
Engage suppliers in accountability, and
-
Commit to continuous improvement.
With these best practices, procurement evolves from a cost-control function into a strategic driver of value, resilience, and sustainability.
Industry-Specific Procurement KPI Examples
While core procurement KPIs apply across industries, different sectors have unique procurement challenges. By tailoring KPIs to industry-specific needs, organizations can measure what truly drives performance in their environment.
Manufacturing Procurement KPIs
Manufacturers rely on complex supply chains, where lead times, quality, and cost efficiency directly affect production schedules and margins.
-
Supplier Lead Time: Track average delivery times to ensure production continuity.
-
Supplier Defect Rate: Monitor quality to reduce rework and waste.
-
Total Cost of Ownership (TCO): Capture lifecycle costs of raw materials and equipment.
-
On-Time Delivery Rate: Prevent production stoppages caused by late shipments.
-
Supplier Risk Rating: Measure exposure to geopolitical, financial, or logistics risks.
Why It Matters: Manufacturing KPIs ensure that procurement supports lean production, minimizes downtime, and maintains quality standards.
Retail & Consumer Goods Procurement KPIs
Retailers manage large volumes of SKUs and need procurement strategies that balance cost, speed, and customer demand.
Key KPIs for Retail & Consumer Goods:
-
Category Spend Breakdown: Analyze procurement costs by product line.
-
Supplier Availability Rate: Ensure stock availability to avoid lost sales.
-
Maverick Spend: Prevent rogue purchasing that undermines margins.
-
On-Time In-Full (OTIF) Deliveries: Track accuracy and timeliness of supplier shipments.
-
Sustainable Procurement Spend: Meet consumer demand for ethical and eco-friendly sourcing.
Why It Matters: Retail KPIs focus on ensuring product availability, cost competitiveness, and sustainability to protect margins and brand reputation.
Services & Professional Procurement KPIs
For service-based businesses (IT, consulting, facilities management), procurement focuses less on physical goods and more on vendor relationships and service quality.
Key KPIs for Services:
-
Stakeholder Satisfaction Score: Track internal customer satisfaction with procurement services.
-
Contract Compliance Rate: Ensure vendors meet service-level agreements (SLAs).
-
Invoice Processing Time: Optimize administrative efficiency.
-
Supplier Responsiveness: Measure how quickly vendors resolve issues.
-
Procurement ROI: Demonstrate value of vendor consolidation and outsourcing.
Why It Matters: Service industry KPIs prioritize vendor reliability, compliance, and cost-effectiveness for outsourced and professional services.
Public Sector & Government Procurement KPIs
Government and public sector procurement requires transparency, accountability, and compliance with strict regulations.
Key KPIs for Public Sector Procurement:
-
Compliance Rate: Track adherence to procurement laws and regulations.
-
Supplier Diversity Spend: Support local, minority-owned, or small business suppliers.
-
Procurement Cycle Time: Ensure timely delivery of critical public services.
-
Cost Savings vs. Budget: Monitor financial efficiency while meeting service mandates.
-
Ethical Sourcing Compliance: Guarantee suppliers follow labor and human rights standards.
Why It Matters: Public sector KPIs emphasize fairness, compliance, and value-for-money to ensure trust and accountability in taxpayer-funded procurement.
Conclusion: Driving Strategic Value With KPIs
Procurement KPIs are more than just numbers on a dashboard — they are the foundation of a high-performing procurement strategy. By measuring cost efficiency, process effectiveness, supplier performance, and sustainability, organizations can transform procurement from a transactional function into a strategic value driver.
Key Lessons from This Guide:
-
Metrics, KPIs, and OKRs are interconnected. Metrics provide raw data, KPIs measure performance, and OKRs turn those measures into strategic, time-bound objectives.
-
The Top 10 Core KPIs (cost savings, ROI, cycle time, supplier performance, compliance, and sustainability) provide a strong foundation for procurement excellence.
-
An Expanded KPI Framework of 30+ measures ensures a comprehensive view of procurement’s financial, operational, supplier, and ESG performance.
-
Dashboards and reporting bring KPIs to life, enabling real-time decision-making and accountability.
-
Best practices include aligning KPIs with strategy, leveraging digital tools, engaging suppliers in performance reviews, and continuously refining targets.
-
Industry-specific KPIs ensure procurement teams focus on the performance drivers that matter most in manufacturing, retail, services, and the public sector.
When applied correctly, procurement KPIs help organizations:
-
Reduce costs while maximizing ROI.
-
Improve efficiency and eliminate bottlenecks.
-
Strengthen supplier performance and mitigate risks.
-
Meet ESG, diversity, and compliance commitments.
-
Align procurement outcomes with corporate strategy.
Final Takeaway: Procurement KPIs are not just about tracking — they are about transformation. The organizations that measure strategically, act on insights, and evolve their KPIs regularly will unlock procurement’s full potential in driving profitability, resilience, and sustainability.
Frequently Asked Questions on Procurement KPIs
Which KPI is more widely used in procurement?
The most widely used KPI in procurement is Cost Savings Achieved. Organizations often focus on how much procurement contributes to reducing spend through negotiations, supplier consolidation, or process improvements. Other commonly tracked KPIs include Purchase Order (PO) Cycle Time, Supplier On-Time Delivery (OTD) Rate, and Spend Under Management (SUM), as these cover cost, efficiency, and supplier performance.
What are the 5 P’s of procurement?
The 5 P’s of procurement are guiding principles that help shape procurement strategies:
-
Price – Ensuring competitive pricing and cost savings.
-
Product – Acquiring goods/services that meet quality standards.
-
Place – Sourcing from the right markets and locations.
-
Promotion – Communicating procurement’s value internally and externally.
-
People – Building relationships with stakeholders and suppliers.
These principles balance cost efficiency with quality, reliability, and collaboration.
What is the KPI dashboard for procurement?
A procurement KPI dashboard is a visual tool that consolidates procurement performance metrics in one place. It helps procurement teams and executives track progress in real time.
Typical dashboard features include:
-
Financial Performance: Cost savings, ROI, TCO.
-
Process Efficiency: PO cycle time, invoice processing cost.
-
Supplier Performance: OTD, defect rate, responsiveness.
-
Sustainability Metrics: Supplier diversity, ESG compliance.
Dashboards are often built using tools like Power BI, Tableau, SAP Ariba, or Coupa and are tailored to the needs of different audiences (executives vs. operations teams).
What is KRA and KPI in procurement?
-
KRA (Key Result Area): Broad responsibility areas within procurement. For example: cost reduction, supplier relationship management, or compliance.
-
KPI (Key Performance Indicator): Specific metrics used to measure performance within each KRA.
Example:
-
KRA: Supplier Performance Management.
-
KPIs: On-Time Delivery Rate, Defect Rate, Supplier Responsiveness.
Together, KRAs define what procurement is responsible for, and KPIs define how success is measured in those areas.
Share this

Essential Inspection in Industry: Best Practices for Quality Assurance
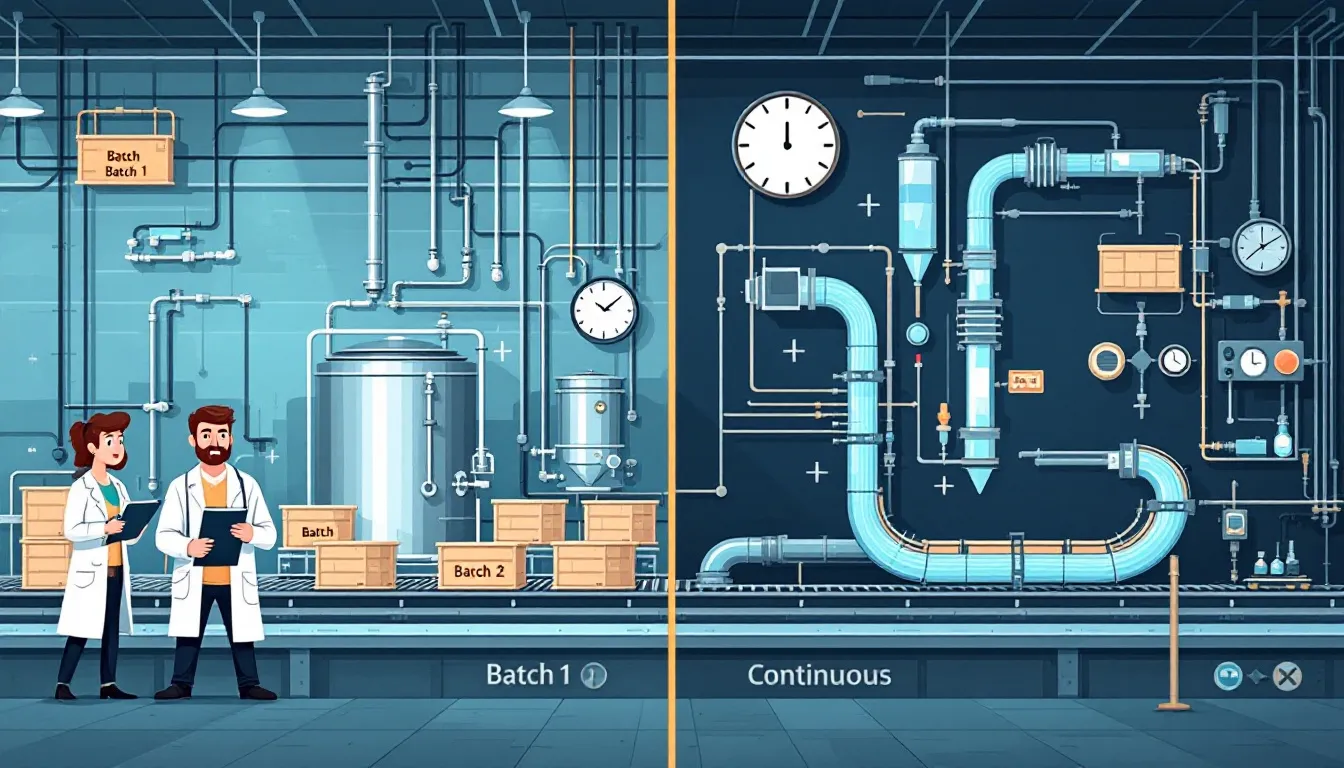
Batch Process vs Continuous Process
.png)
No Comments Yet
Let us know what you think